1. Abstract
An experimental verification of general relativity conception was made using an atomic maser in a rocket attaining an altitude of 1,800 metres.
The signal of the maser was monitored on the ground, so that the effect of gravitational potential on the frequency of the maser was measured.
The resulting data was processed through a careful prediction and elimination of the Doppler shift and other error resources, so that the
gravitational blue shift is directly observed. The experiment is described including a consummate discussion of navigation algorithm applied in the
processing procedure. The authors believe that this is a direct high accuracy test of the general relativistic phenomena using an airborne clock.
2.Introduction
A rocket is constructed and launched carrying an atomic frequency standard as the payload. The frequency of the signal from the atomic
frequency standard is examined on the ground.
Another atomic frequency standard is used as a comparison to monitor the change in frequency of the received signal from the payload.
A group of variables that will influence the change are eliminated so that the resulting data, representing the relativistic shifts, are recovered and
recorded.
The objective of the experiment is to test general relativity concept by measuring directly the effect of gravitational potential on the
frequency of a proper clock, in this case the atomic frequency standard.
In this experiment, a gravitational effect amounting to 5.6e-13 was measured.
![89_3212_2c1121e5346aa53.png]()
The predicted proportion change in frequency is expressed in equation [a].Where β is the velocity/c and r is the displacement of the rocket
relative to theground base. ais the centrifugal acceleration of the ground station while ε represents thepropagation vector of the rocket-to-ground
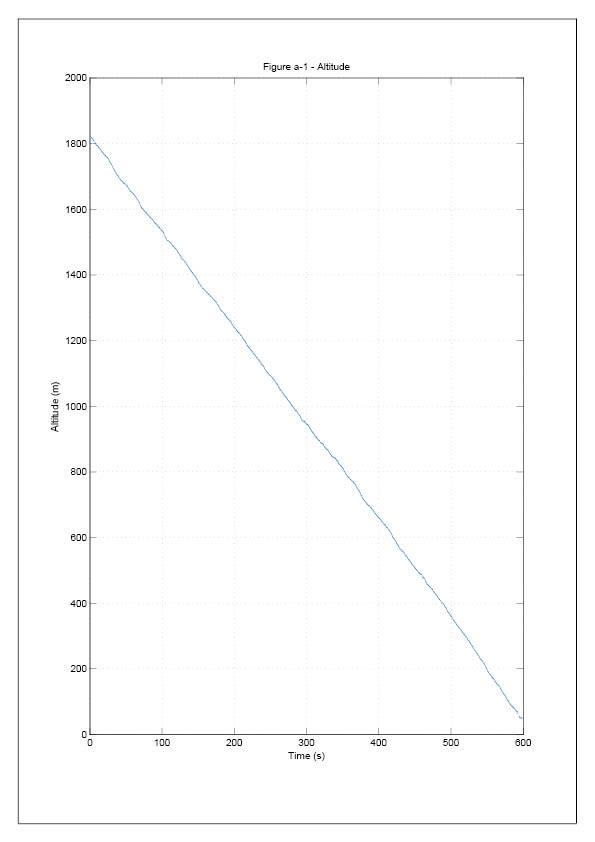
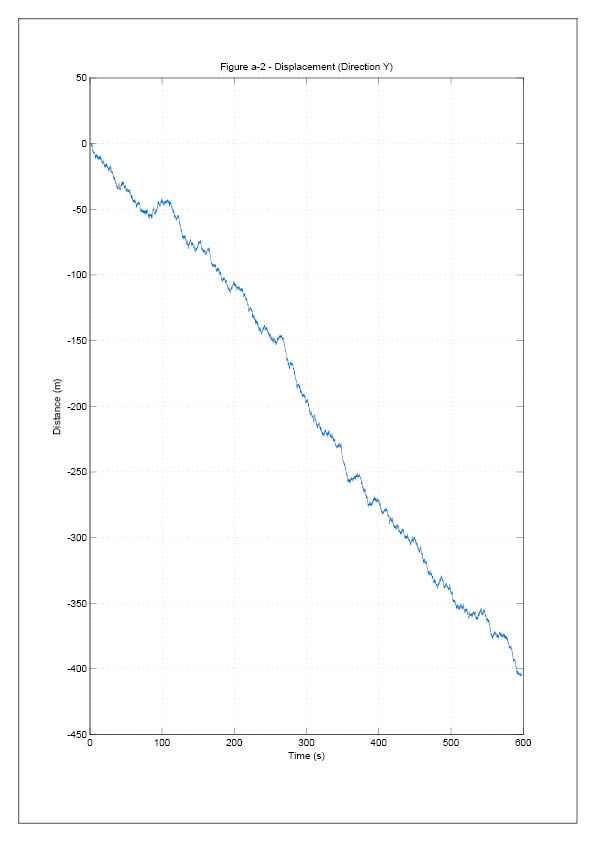
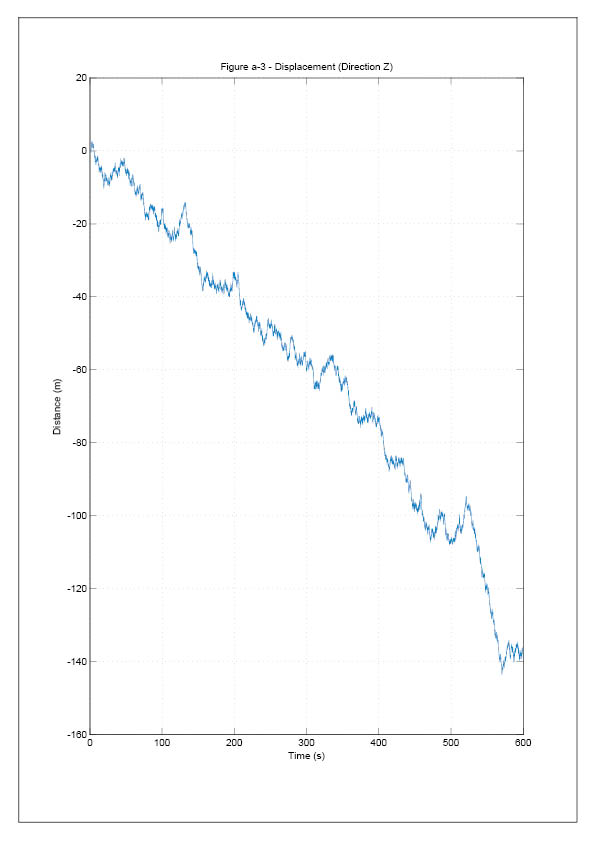
signal. Our knowledge of the relative velocityand displacement of the rocket is obtained from the flight data recorder installed in thepayload. As
we chose the ground base as the navigation frame, the movement of the groundbase in the geographic frame was straightly eliminated in the
navigation system.
In equation [1], the first term is the gravitational blue shift, the second term expressesthe Doppler shift. The last term describes the effect of the
rotation of the earth during thepropagation of the signal. In the elimination of the second and third terms, out knowledge ofthe rocket's velocity
and position are obtained from the FDR(Flight Data Recorder) while theknowledge of the velocity and position of the ground base is gained from
the Earth Modeland GLarLng of the launching site.
The specific procedure is exhibited in the materials and methods section.
3. Materials and Methods
The data was first generated and collected after the hardware processing of ground base, which procedure is labeled as data
acquisition. The recorded data was then stored in the computer for further processing, labeled as Data processing.
Data acquisition
a) Algebra description
The frequency signal transmitted from the payload is fixed at f0 + △f.
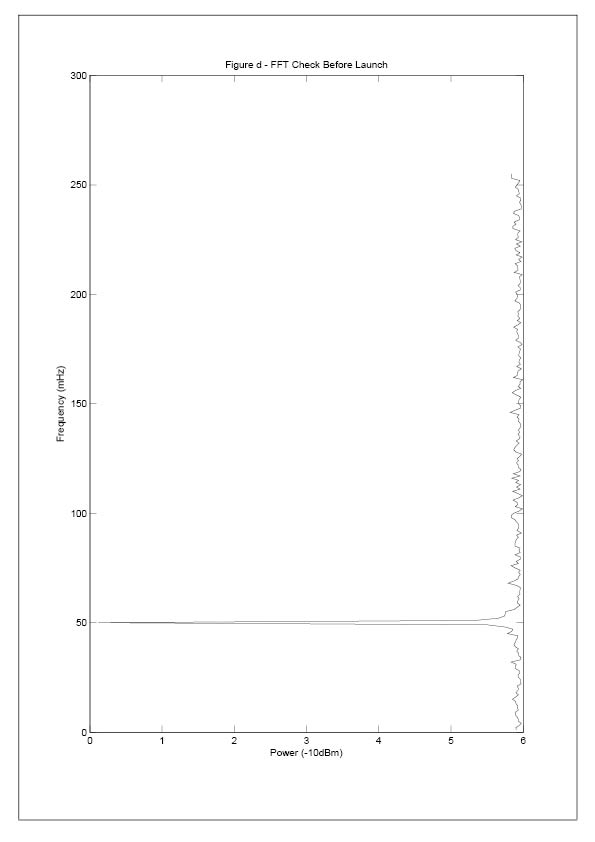
△f was set to be 50mHz (Figure [d]).
The signal received on the ground base is labeled as f1. It is predicted to be
![89_3212_8ebdc468c1d5dee.png]()
after the elimination of errors.
The ground station processed f1 with a standard signal of frequency f0 , which was generated by the atomic frequency standard.
Heterodyne-beat method was applied thus a signal with frequency f1 - f0 was sampled by a high speed analog to digital converter as f2 and
processed by the digital signal processor. A standard signal of frequency△f is generated by atomic frequency standard and processed in the
computer, a series of effects including doppler shift are taken into account.
![89_3212_a6c129b3bd444a1.png]()
The final signal, labeled △fR, is expressed by equation [2].
The frequency of f2 was estimated by 4-parameter estimation algorithm and recorded in the computer. The method of 4-parameter
estimation will be discussed later.
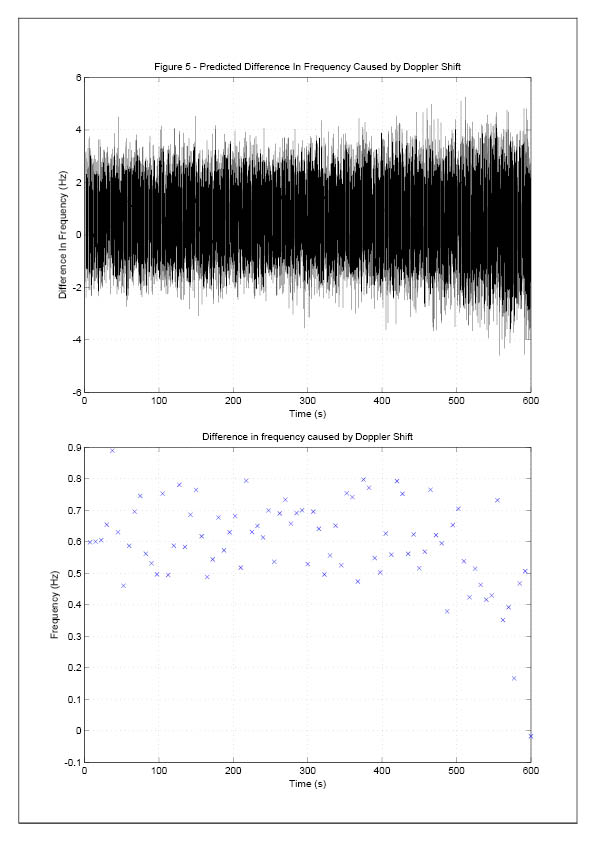
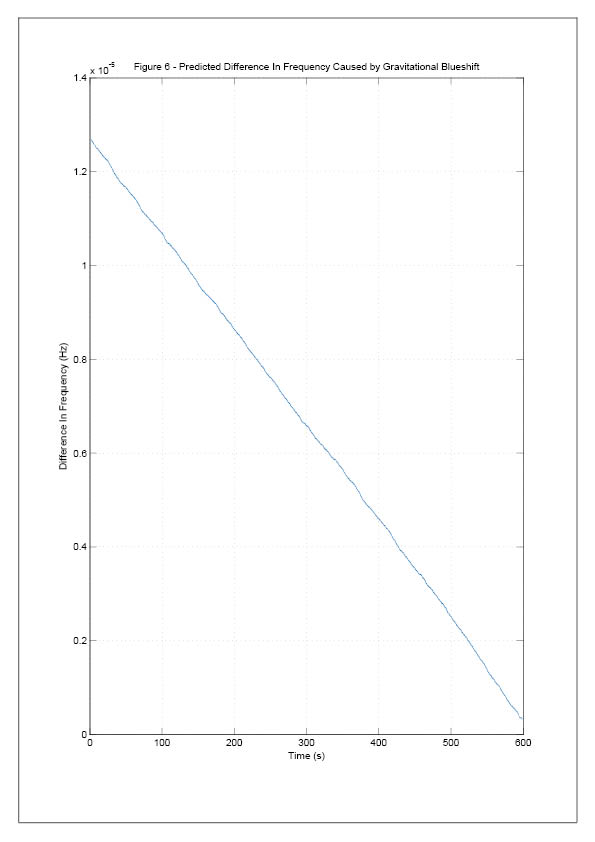
Therefore, the resulting data was obtained. The predicted behaviour of this final signal is shown in figure [6].
b) Technical details
A transmitter and a superheterodyne receiver were built specially for the experiment.
The signal from the on-board AFS(Atomic Frequency Standard) was directly amplified and transmitted. The output power of the amplifier
was +38dBm and the frequency was 63.8978MHz.
The structure of the receiver is shown below.
![89_3212_ad687185031af58.png]()
The signal from the antenna at the ground base was filtered and directly amplified by a LNA(Low Noise Amplifier) and mixed with FS1 by
mixer 1 to obtain an IF(Intermediate Frequency) with a frequency of 5MHz. The IF signal was processed by an AGC(Automatic Gain Control) circuit
so that the amplitude was stabilized. This processed IF signal was mixed with FS2 by mixer 2 to obtain a 50mHz signal and was converted into
digital signal by a high speed ADC. The exact frequency of the signal sampled by the ADC was estimated through 4-parameter estimation
algorithm. FS1 and FS2 were generated by the AFS at the ground base.
1) The realization of heterodyne-beat method
The kernel of heterodyne-beat method is the shift of spectrum. As a result, a mixer is used to obtain the difference in frequency of two
signals. In this application, two integrated mixer circuits AD831 were used.
The following images indicate a test result for the mixer circuit. The left image indicates the signal of RF input of the mixer and another
one shows the local oscillation input of the mixer. They were generated by two DDS(Direct Digital Synthesis) circuits. The clock standard of the DDS
circuits was connected to an AFS. The frequencies of them were 7MHz and 7.00001MHz.
![89_3212_39ba13ad36d69c6.png]()
The following image shows the output of the mixer which equals to the difference between two frequency signals connected to the local
oscillation input and the RF input. Here, the difference was 10Hz.
![89_3212_e986b0b187d1591.png]()
2) The design of AGC circuit
An AGC circuit was used to stabilize the amplitude of IF signal.
The input signal was demodulated and filtered into a voltage signal represents the strength of the signal. This voltage signal was used to
control the gain of a VGA(Variable Gain Amplifier).
![89_3212_b7c175c0b8d1d28.png]()
In this case, the wave-detector was AD8307 and the VGA was AD603.
A test for the AGC module is shown below. Channel 1 was connected to the output of the AGC module, channel 2 was connected to the
input. The input of the AGC module was connected to a function generator.
![89_3212_6ef97729f1b3e9e.png]()
As the waveform shown on the oscilloscope, although the amplitude of the input signal to the AGC was changed, the amplitude of output
signal of it remained the same.
A test result for the transmitter and the receiver is shown below.
The transmitter was placed 800 metres away from the receiver. The image on the left shows the output signal from the transmitter and
another image shows the signal sampled from the output of LNA of the receiver.
![89_3212_78b25b063e5b25f.png]()
The image below shows the signal sampled from the output of the AGC module, where frequency = IF = 5MHz.
![89_3212_0ac36d72e4fc80f.png]()
2) Method of estimation of frequency
a) Definition of 4 parameters
Assume the sampled signal S(t) is given by
![89_3212_c9fb093f1806ae3.png]()
Where A0' is the ideal amplitude of the signal, ω0' is the ideal frequency of the signal, C0' is the ideal DC offset of the signal and θ0' is
the ideal phase of the signal.
The signal can be expressed by the equation
![89_3212_ecda786a24388df.png]()
Where
![89_3212_0cc8a3fd71a0365.png]()
Suppose the magnitude of the signal sampled during time tk(k = 0, 1, 2, ...) is y(k), is given by
![89_3212_02d7d24322d9add.png]()
b) Method of 3-parameter estimation
Suppose the sampled voltage value of the signal at time tk is y(k), k = 1, 2, 3 ...N-1. The amplitude of sine, amplitude of cosine and DC
offset is defined as A,B and C. The RSS(Residual Sum of Squares) between the estimation value and actual value is given by
![89_3212_02d7d24322d9add.png]()
Where N is the length of samples, set
![89_3212_0305609420535ee.png]()
The solution for X is given by the least square solution below:
.![89_3212_7464e862349ac20.png]()
c) 4-parameter estimation algorithm
The idea of successive approximation is applied in this algorithm. First, a rough frequency is given, 3-parameter estimation algorithm is
applied to the sampled signal. The cosine amplitude, sine amplitude, DC offset and estimated RSS are obtained. The operation is repeated with
different frequencies so a serial of estimated RSS are obtained. One of those set of obtained result with minimum estimated RSS is the value of
actual frequency. The detailed steps are shown below.
1) Determine the frequency of the signal roughly though DFT(Discrete Fourier Transform), label this frequency as f0.
2) Set the domain of iteration to be ωdl and ωdu, where ωdl is the lower boundary, given by ωdl = f0 - fclk / N. ωdu is the upper
boundary, given by ωdu = f0 + fclk / N. fclk is the frequency of sampling clock and N is the length of DFT.
3) Set ω0 = ωdu - ωdl. 2M+1 points (M∈N*) are samples between ωdl and ωdu with equal intervals. 3-parameter estimation algorithm
is used here to compute the RSS of this group of samples.
4) Find and record the minimum value of RSS of samples in step 3 This minimum value is corresponding to the actual frequency.
Repeat operations 2 to 4 until the precision of the estimation reaches the required level.
A picture of the receiver is shown below.
![89_3212_ea6c2652ccbac32.jpg]()
2) Data processing
a) Downlink signal
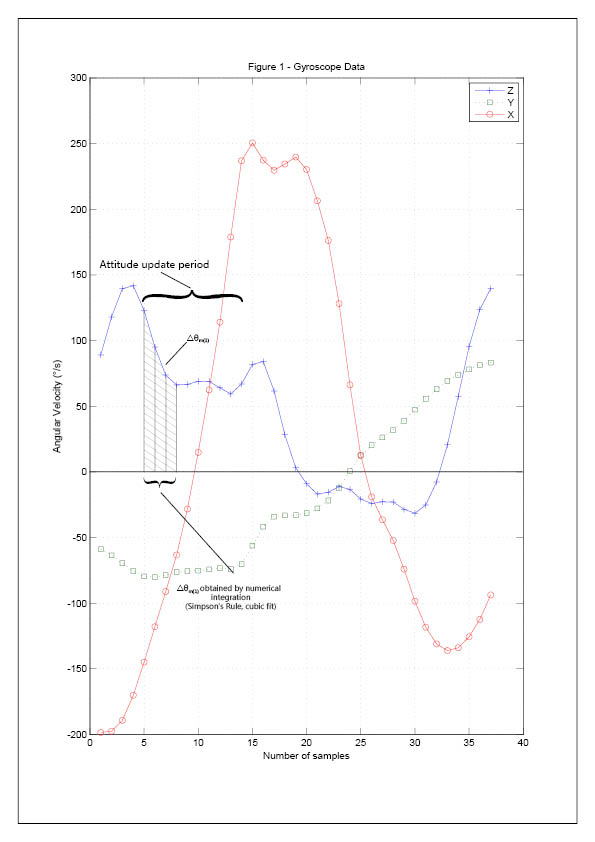
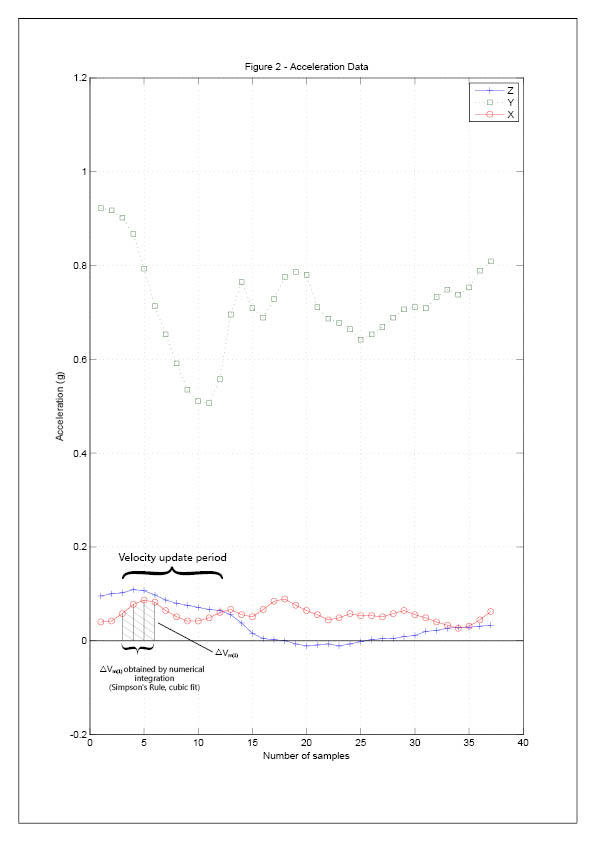
The navigation system provided data of dynamics with a sample rate of 1,200 samples per second. The data was given in terms of
angular velocity and acceleration in the on-board coordinate. The six groups of parameters are ωx, ωy, ωz, ax, ay and a--z, respectively where the
X-axis if the mean axis of the rocket.
In the determination of change in angle, △θ and change in velocity, △V, the cubic spline function is adopted in curve fitting before
integration. This method of Simpson's rule provides six groups of data: △θx, △θy, △θz, △Vx, △Vy and △Vz. As a result, the behaviour of the rocket
between samples are predicted and considered.
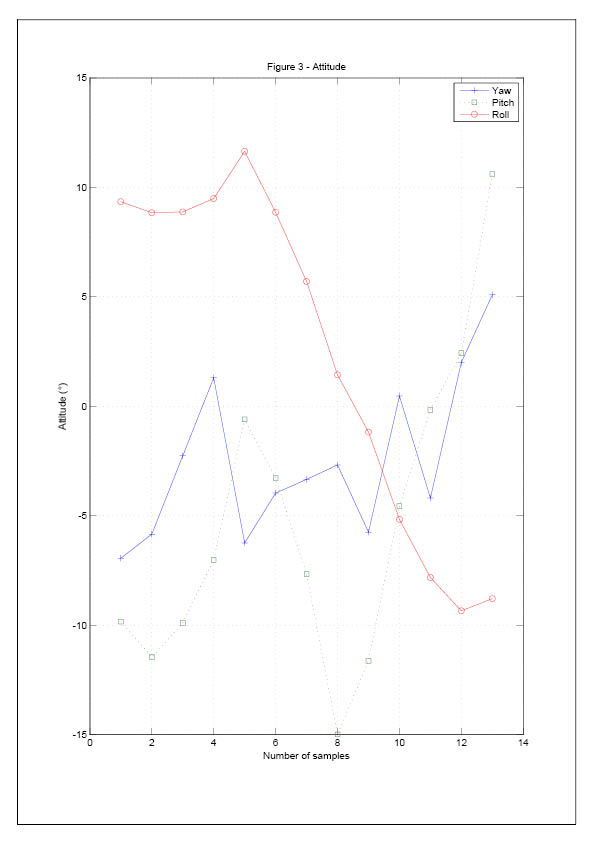
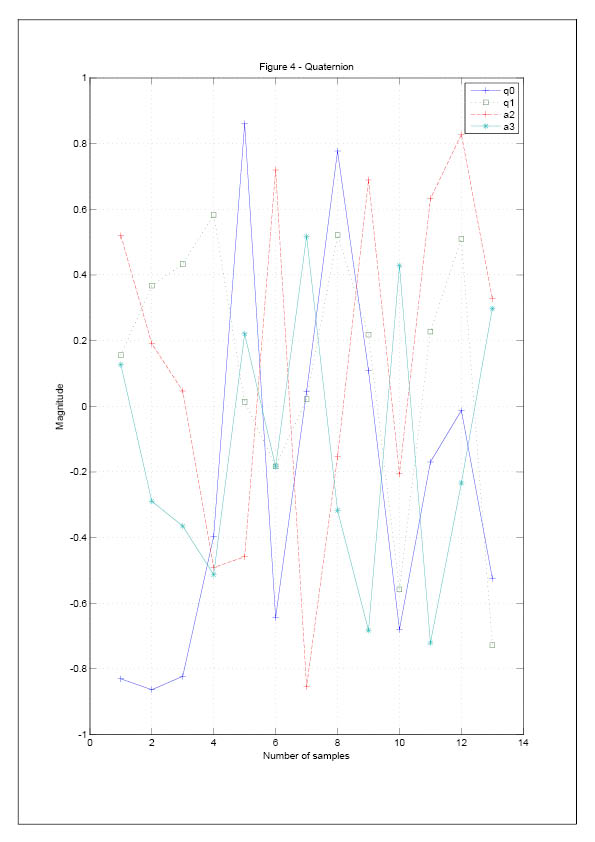
In the determination of attitude angle, the method of Quaternion is applied.
The quaternion numbers at time tm+1 are given in equation [9], where △θx, △θy and △θz are the output of change in angle and vector Φ
is the rotation vector, which is given by equation [9]
![89_3212_a12b63b637c646d.png]()
In equation [9] and [10], the angular velocity of the rocket is assumed to fit cubic function. However, the actual angular velocity does not
fit a cubic function.
Equations [9] and [10] do not achieve minimum shift of algorithm. After the parachute deployment, the rocket was suspended in the
descending stage. Thus the rocket is likely to experience coning motion, which means that the rocket vibrate about the equilibrium position at
small angles. The coning motion is the worst working environment for the SINS(Strapdown Inertial Navigation System) as it will cause serve shift of
the Math Platform.
For optimization algorithms, the following improvements are made.
O-XYZ represents the reference frame R, which is the on-board frame when the rocket is in equilibrium.
Let b(tm-1) and b(tm) to be the instantaneous on-board frame at time tm-1 and tm.
According to Euler Theorem, O-XYZ can be regarded as a rotating transformation of b(tm) or b(tm-1) with rotating vector Q(t) given in
equation [11].
![89_3212_de97d6be41dc68a.png]()
The shift on-board frame can be regarded as a rotation transformation of the ideal on-board frame, which is the frame when the rocket
is in equilibrium. The samples of △θ is grouped in three again.
In each group, the samples are labeled as .
![89_3212_6ccb8c643dbc172.png]()
Equation [12] is an improved form of equation [3]. By selecting proper constant k1 and k2, the effect of the coning motion is minimised.
Here, the ideal values for k1 and k2 are 0.45 and 0.675.
Therefore, the attitude of the rocket is found through the optimized quaternion algorithm. The Eular angles are found by equation [13].
![89_3212_d725c14d792870b.png]()
The quaternions are supposed to be standardized. However, resulting form calculation errors and other factors, the quaternion numbers
gradually loses standability. The standardization of quaternion numbers is applied at the end of each period of attitude refreshment. The formula
for standardization is given by equation [8].
![89_3212_e482b8e4478b23f.png]()
Where is the standardization value and is the value after attitude refreshment.
So far, the discussion of the rocket's dynamic is in the on-board coordinate. However, the final results have to be expressed in the
navigation frame, which sets the ground base as the origin.
![89_3212_f967691ce18ffaf.png]()
Equation [15] gives the coordinate transformation matrix (attitude matrix) from on-board frame to navigation frame in terms of quaternion.
The initial extraction quaternion numbers are thus given by the initial attitude matrix obtained in initial azimuth alignment.
![89_3212_138eab743f34052.png]()
The velocity of the rocket at time tm in the navigation frame, Vm, is given by equation [16], containing a series of error compensations.
Vm-1 is the velocity in the same frame at time
tm-1. Cm-1 is the coordinate transformation matrix at time tm-1. Vm-1 is the compensation velocity caused by while△Vg/corm is the
compensation velocity caused by the deleterious acceleration. △Vsfm is the compensation velocity caused by ecific force.
![89_3212_8920db87aa54e07.png]()
Where△Vm us the change in velocity during period [tm-1, tm].
△Vrotm is the compensation velocity caused by rotation effect.
△Vsculm is the compensation velocity caused by sculling motion.
Due to air current, gustiness and other factors, the rocket experiences vibrations during the flight. Those factors cause a highly dynamic
working environment for the payload. Therefore, the velocity has to be compensated so that the sculling effect and the rotation effect are
eliminated. Otherwise, the calculation of velocity will involve serve errors. When it comes to position determination, there two error resources
contribute to scroll errors. Here△Vrotm and△Vsculm represent the compensation velocities due to the rotation effect and the sculling effect
respectively. the rotation effect happens when the direction of linear velocity rotates in a three-dimensional coordinate. The sculling effect is
caused by the angular vibration and linear vibration are in phase and of same frequency on the rocket. This is quite similar to the sculling motion:
on one hand, the syrup vibrates periodically about the lateral axis of the boat. On the other hand, the boat forges ahead along the direct-axis in
an intermittent behaviour.
The original expression for △Vrotm and △Vsculm are:
![89_3212_6e82c0317f035dd.png]()
The optimized formula for △Vrotm and △Vsculm are
![89_3212_4bc6470e9aff612.png]()
The optimized algorithm for sculling effect rotation effect, in velocity determination as well as the correction for conning motion in
attitude determination make sure that the motion of the layload is precisely calculated in spite of the unstable motion of the rocket. Hence the
cancelling of doppler effect and second-order general relativity conception shift are more reliable. The specific precision level is related in the
discussion section.
The final expression for Vm is given by equation [22]:
![89_3212_f99b93f526f8aab.png]()
Considering that all the compensation dosages have been taken into account the calculation of Vm and that the data is discrete with
equal time internals, the data of displacement, is obtained through numerical integration.
As the dynamic data is determined, the following equations are substituted into
equation [2].
![89_3212_20b2600e727cda1.png]()
Where c is the velocity of light, Wen is the angular velocity of the earth in the navigation frame and is the radius vector of the earth at
the launching spot.
The frequency of this signal is plotted against time in Figure [5].
The navigation algorithm aims to calculate the velocity of the rocket in the navigation frame. However, the accelerometer does not tell
deleterious acceleration and relative acceleration of the rocket. Therefore, the compensation velocity has to be estimated from the measure value.
![89_3212_c4b7c06fb1b8931.png]()
Where g is the gravitational acceleration of the launch site.
In equation [24], the second term represents the centripetal force of the navigation frame, which rotates about the earth. The third term
is the coloris acceleration due to the interference of the and . The coloris acceleration is when the rocket experiences a relative velocity to the
navigation frame, while the navigation frame rotates itself.
Substituting the data obtained from the FDR module, which are ωx, ωy, ωz, ax, ay and az during the flight into the equation [24], data of
velocity is obtained.
A compensated with the data of frequency monitored from the ground base, the dynamic data is applied in the following Doppler-
cancelling system.
The doppler shift is given by equation [25]
![89_3212_0b133386bb928bf.png]()
Theta is given by
![89_3212_6711689874783ed.png]()
In the former process, the dynamic data of each sample is recorded with its corresponding frequency monitored.
Thus doppler shift effect of the downlink signal eliminated. Now this signal is sipposed to be given by the following equation
![89_3212_9c46c5dd8dbb284.png]()
This is the pure relativistic shift of the downlink signal.
b) Comparison group
The data of the transmitter on the payload, was real time recorded, which is linearly related to the time standard on the payload. As the
payload experiences a relative velocity to the navigation frame, the clock effect is considered. The following cancellation applies to the special
Relativity Conception. For the time base, the original time interval between two pulses tm-1 and tm is △ t.
![89_3212_8bf39b550e9b400.png]()
The data of the time base experienced former processing with the dynamic data, thus the actual transmitted signal is calculated from the
corrected time base in the computer. This signal is labeled as fair. Fair is processed to predicted relativistic shift.![89_3212_ede542837b66b9b.png]()
An experimental verification of general relativity conception was made using an atomic maser in a rocket attaining an altitude of 1,800 metres.
The signal of the maser was monitored on the ground, so that the effect of gravitational potential on the frequency of the maser was measured.
The resulting data was processed through a careful prediction and elimination of the Doppler shift and other error resources, so that the
gravitational blue shift is directly observed. The experiment is described including a consummate discussion of navigation algorithm applied in the
processing procedure. The authors believe that this is a direct high accuracy test of the general relativistic phenomena using an airborne clock.
2.Introduction
A rocket is constructed and launched carrying an atomic frequency standard as the payload. The frequency of the signal from the atomic
frequency standard is examined on the ground.
Another atomic frequency standard is used as a comparison to monitor the change in frequency of the received signal from the payload.
A group of variables that will influence the change are eliminated so that the resulting data, representing the relativistic shifts, are recovered and
recorded.
The objective of the experiment is to test general relativity concept by measuring directly the effect of gravitational potential on the
frequency of a proper clock, in this case the atomic frequency standard.
In this experiment, a gravitational effect amounting to 5.6e-13 was measured.

The predicted proportion change in frequency is expressed in equation [a].Where β is the velocity/c and r is the displacement of the rocket
relative to theground base. ais the centrifugal acceleration of the ground station while ε represents thepropagation vector of the rocket-to-ground
signal. Our knowledge of the relative velocityand displacement of the rocket is obtained from the flight data recorder installed in thepayload. As
we chose the ground base as the navigation frame, the movement of the groundbase in the geographic frame was straightly eliminated in the
navigation system.
In equation [1], the first term is the gravitational blue shift, the second term expressesthe Doppler shift. The last term describes the effect of the
rotation of the earth during thepropagation of the signal. In the elimination of the second and third terms, out knowledge ofthe rocket's velocity
and position are obtained from the FDR(Flight Data Recorder) while theknowledge of the velocity and position of the ground base is gained from
the Earth Modeland GLarLng of the launching site.
The specific procedure is exhibited in the materials and methods section.
3. Materials and Methods
The data was first generated and collected after the hardware processing of ground base, which procedure is labeled as data
acquisition. The recorded data was then stored in the computer for further processing, labeled as Data processing.
Data acquisition
a) Algebra description
The frequency signal transmitted from the payload is fixed at f0 + △f.
△f was set to be 50mHz (Figure [d]).
The signal received on the ground base is labeled as f1. It is predicted to be

after the elimination of errors.
The ground station processed f1 with a standard signal of frequency f0 , which was generated by the atomic frequency standard.
Heterodyne-beat method was applied thus a signal with frequency f1 - f0 was sampled by a high speed analog to digital converter as f2 and
processed by the digital signal processor. A standard signal of frequency△f is generated by atomic frequency standard and processed in the
computer, a series of effects including doppler shift are taken into account.

The final signal, labeled △fR, is expressed by equation [2].
The frequency of f2 was estimated by 4-parameter estimation algorithm and recorded in the computer. The method of 4-parameter
estimation will be discussed later.
Therefore, the resulting data was obtained. The predicted behaviour of this final signal is shown in figure [6].
b) Technical details
A transmitter and a superheterodyne receiver were built specially for the experiment.
The signal from the on-board AFS(Atomic Frequency Standard) was directly amplified and transmitted. The output power of the amplifier
was +38dBm and the frequency was 63.8978MHz.
The structure of the receiver is shown below.

The signal from the antenna at the ground base was filtered and directly amplified by a LNA(Low Noise Amplifier) and mixed with FS1 by
mixer 1 to obtain an IF(Intermediate Frequency) with a frequency of 5MHz. The IF signal was processed by an AGC(Automatic Gain Control) circuit
so that the amplitude was stabilized. This processed IF signal was mixed with FS2 by mixer 2 to obtain a 50mHz signal and was converted into
digital signal by a high speed ADC. The exact frequency of the signal sampled by the ADC was estimated through 4-parameter estimation
algorithm. FS1 and FS2 were generated by the AFS at the ground base.
1) The realization of heterodyne-beat method
The kernel of heterodyne-beat method is the shift of spectrum. As a result, a mixer is used to obtain the difference in frequency of two
signals. In this application, two integrated mixer circuits AD831 were used.
The following images indicate a test result for the mixer circuit. The left image indicates the signal of RF input of the mixer and another
one shows the local oscillation input of the mixer. They were generated by two DDS(Direct Digital Synthesis) circuits. The clock standard of the DDS
circuits was connected to an AFS. The frequencies of them were 7MHz and 7.00001MHz.

The following image shows the output of the mixer which equals to the difference between two frequency signals connected to the local
oscillation input and the RF input. Here, the difference was 10Hz.

2) The design of AGC circuit
An AGC circuit was used to stabilize the amplitude of IF signal.
The input signal was demodulated and filtered into a voltage signal represents the strength of the signal. This voltage signal was used to
control the gain of a VGA(Variable Gain Amplifier).

In this case, the wave-detector was AD8307 and the VGA was AD603.
A test for the AGC module is shown below. Channel 1 was connected to the output of the AGC module, channel 2 was connected to the
input. The input of the AGC module was connected to a function generator.

As the waveform shown on the oscilloscope, although the amplitude of the input signal to the AGC was changed, the amplitude of output
signal of it remained the same.
A test result for the transmitter and the receiver is shown below.
The transmitter was placed 800 metres away from the receiver. The image on the left shows the output signal from the transmitter and
another image shows the signal sampled from the output of LNA of the receiver.

The image below shows the signal sampled from the output of the AGC module, where frequency = IF = 5MHz.

2) Method of estimation of frequency
a) Definition of 4 parameters
Assume the sampled signal S(t) is given by

Where A0' is the ideal amplitude of the signal, ω0' is the ideal frequency of the signal, C0' is the ideal DC offset of the signal and θ0' is
the ideal phase of the signal.
The signal can be expressed by the equation

Where

Suppose the magnitude of the signal sampled during time tk(k = 0, 1, 2, ...) is y(k), is given by

b) Method of 3-parameter estimation
Suppose the sampled voltage value of the signal at time tk is y(k), k = 1, 2, 3 ...N-1. The amplitude of sine, amplitude of cosine and DC
offset is defined as A,B and C. The RSS(Residual Sum of Squares) between the estimation value and actual value is given by

Where N is the length of samples, set

The solution for X is given by the least square solution below:
.

c) 4-parameter estimation algorithm
The idea of successive approximation is applied in this algorithm. First, a rough frequency is given, 3-parameter estimation algorithm is
applied to the sampled signal. The cosine amplitude, sine amplitude, DC offset and estimated RSS are obtained. The operation is repeated with
different frequencies so a serial of estimated RSS are obtained. One of those set of obtained result with minimum estimated RSS is the value of
actual frequency. The detailed steps are shown below.
1) Determine the frequency of the signal roughly though DFT(Discrete Fourier Transform), label this frequency as f0.
2) Set the domain of iteration to be ωdl and ωdu, where ωdl is the lower boundary, given by ωdl = f0 - fclk / N. ωdu is the upper
boundary, given by ωdu = f0 + fclk / N. fclk is the frequency of sampling clock and N is the length of DFT.
3) Set ω0 = ωdu - ωdl. 2M+1 points (M∈N*) are samples between ωdl and ωdu with equal intervals. 3-parameter estimation algorithm
is used here to compute the RSS of this group of samples.
4) Find and record the minimum value of RSS of samples in step 3 This minimum value is corresponding to the actual frequency.
Repeat operations 2 to 4 until the precision of the estimation reaches the required level.
A picture of the receiver is shown below.

2) Data processing
a) Downlink signal
The navigation system provided data of dynamics with a sample rate of 1,200 samples per second. The data was given in terms of
angular velocity and acceleration in the on-board coordinate. The six groups of parameters are ωx, ωy, ωz, ax, ay and a--z, respectively where the
X-axis if the mean axis of the rocket.
In the determination of change in angle, △θ and change in velocity, △V, the cubic spline function is adopted in curve fitting before
integration. This method of Simpson's rule provides six groups of data: △θx, △θy, △θz, △Vx, △Vy and △Vz. As a result, the behaviour of the rocket
between samples are predicted and considered.
In the determination of attitude angle, the method of Quaternion is applied.
The quaternion numbers at time tm+1 are given in equation [9], where △θx, △θy and △θz are the output of change in angle and vector Φ
is the rotation vector, which is given by equation [9]

In equation [9] and [10], the angular velocity of the rocket is assumed to fit cubic function. However, the actual angular velocity does not
fit a cubic function.
Equations [9] and [10] do not achieve minimum shift of algorithm. After the parachute deployment, the rocket was suspended in the
descending stage. Thus the rocket is likely to experience coning motion, which means that the rocket vibrate about the equilibrium position at
small angles. The coning motion is the worst working environment for the SINS(Strapdown Inertial Navigation System) as it will cause serve shift of
the Math Platform.
For optimization algorithms, the following improvements are made.
O-XYZ represents the reference frame R, which is the on-board frame when the rocket is in equilibrium.
Let b(tm-1) and b(tm) to be the instantaneous on-board frame at time tm-1 and tm.
According to Euler Theorem, O-XYZ can be regarded as a rotating transformation of b(tm) or b(tm-1) with rotating vector Q(t) given in
equation [11].

The shift on-board frame can be regarded as a rotation transformation of the ideal on-board frame, which is the frame when the rocket
is in equilibrium. The samples of △θ is grouped in three again.
In each group, the samples are labeled as .

Equation [12] is an improved form of equation [3]. By selecting proper constant k1 and k2, the effect of the coning motion is minimised.
Here, the ideal values for k1 and k2 are 0.45 and 0.675.
Therefore, the attitude of the rocket is found through the optimized quaternion algorithm. The Eular angles are found by equation [13].

The quaternions are supposed to be standardized. However, resulting form calculation errors and other factors, the quaternion numbers
gradually loses standability. The standardization of quaternion numbers is applied at the end of each period of attitude refreshment. The formula
for standardization is given by equation [8].

Where is the standardization value and is the value after attitude refreshment.
So far, the discussion of the rocket's dynamic is in the on-board coordinate. However, the final results have to be expressed in the
navigation frame, which sets the ground base as the origin.

Equation [15] gives the coordinate transformation matrix (attitude matrix) from on-board frame to navigation frame in terms of quaternion.
The initial extraction quaternion numbers are thus given by the initial attitude matrix obtained in initial azimuth alignment.

The velocity of the rocket at time tm in the navigation frame, Vm, is given by equation [16], containing a series of error compensations.
Vm-1 is the velocity in the same frame at time
tm-1. Cm-1 is the coordinate transformation matrix at time tm-1. Vm-1 is the compensation velocity caused by while△Vg/corm is the
compensation velocity caused by the deleterious acceleration. △Vsfm is the compensation velocity caused by ecific force.

Where△Vm us the change in velocity during period [tm-1, tm].
△Vrotm is the compensation velocity caused by rotation effect.
△Vsculm is the compensation velocity caused by sculling motion.
Due to air current, gustiness and other factors, the rocket experiences vibrations during the flight. Those factors cause a highly dynamic
working environment for the payload. Therefore, the velocity has to be compensated so that the sculling effect and the rotation effect are
eliminated. Otherwise, the calculation of velocity will involve serve errors. When it comes to position determination, there two error resources
contribute to scroll errors. Here△Vrotm and△Vsculm represent the compensation velocities due to the rotation effect and the sculling effect
respectively. the rotation effect happens when the direction of linear velocity rotates in a three-dimensional coordinate. The sculling effect is
caused by the angular vibration and linear vibration are in phase and of same frequency on the rocket. This is quite similar to the sculling motion:
on one hand, the syrup vibrates periodically about the lateral axis of the boat. On the other hand, the boat forges ahead along the direct-axis in
an intermittent behaviour.
The original expression for △Vrotm and △Vsculm are:

The optimized formula for △Vrotm and △Vsculm are

The optimized algorithm for sculling effect rotation effect, in velocity determination as well as the correction for conning motion in
attitude determination make sure that the motion of the layload is precisely calculated in spite of the unstable motion of the rocket. Hence the
cancelling of doppler effect and second-order general relativity conception shift are more reliable. The specific precision level is related in the
discussion section.
The final expression for Vm is given by equation [22]:

Considering that all the compensation dosages have been taken into account the calculation of Vm and that the data is discrete with
equal time internals, the data of displacement, is obtained through numerical integration.
As the dynamic data is determined, the following equations are substituted into
equation [2].

Where c is the velocity of light, Wen is the angular velocity of the earth in the navigation frame and is the radius vector of the earth at
the launching spot.
The frequency of this signal is plotted against time in Figure [5].
The navigation algorithm aims to calculate the velocity of the rocket in the navigation frame. However, the accelerometer does not tell
deleterious acceleration and relative acceleration of the rocket. Therefore, the compensation velocity has to be estimated from the measure value.

Where g is the gravitational acceleration of the launch site.
In equation [24], the second term represents the centripetal force of the navigation frame, which rotates about the earth. The third term
is the coloris acceleration due to the interference of the and . The coloris acceleration is when the rocket experiences a relative velocity to the
navigation frame, while the navigation frame rotates itself.
Substituting the data obtained from the FDR module, which are ωx, ωy, ωz, ax, ay and az during the flight into the equation [24], data of
velocity is obtained.
A compensated with the data of frequency monitored from the ground base, the dynamic data is applied in the following Doppler-
cancelling system.
The doppler shift is given by equation [25]

Theta is given by

In the former process, the dynamic data of each sample is recorded with its corresponding frequency monitored.
Thus doppler shift effect of the downlink signal eliminated. Now this signal is sipposed to be given by the following equation

This is the pure relativistic shift of the downlink signal.
b) Comparison group
The data of the transmitter on the payload, was real time recorded, which is linearly related to the time standard on the payload. As the
payload experiences a relative velocity to the navigation frame, the clock effect is considered. The following cancellation applies to the special
Relativity Conception. For the time base, the original time interval between two pulses tm-1 and tm is △ t.

The data of the time base experienced former processing with the dynamic data, thus the actual transmitted signal is calculated from the
corrected time base in the computer. This signal is labeled as fair. Fair is processed to predicted relativistic shift.






200字以内,仅用于支线交流,主线讨论请采用回复功能。